What would it mean for your business if you had one more long-term, devoted customers? What about 5, 10, or 100?
Click here to access The Account Management KPI Calculator
To input your own data, log into your Google account –> click “file” –> “make a copy”
http://danenglander1.wistia.com/medias/2bk4fea1zn?embedType=async&videoFoam=true&videoWidth=800
More than any other exercise, careful planning and visualization helped us achieve seven-figure revenues among dozens of Fortune 500 customers, starting from a few minor freelance projects. Forecasting is the first step we took to build a profitable account management process. This process became our sales machine, one that churned out deal after lucrative deal.
To achieve any outcome, it’s imperative to visualize it. To visualize it, you have to break it down into small, tangible wins. To do that, you’ll need to crunch some numbers.
In this article and the above video, you’ll learn how to plan for six-figure accounts. In the article following this one, you’ll learn how to actually act on these plans, and make “fantasy” in a reality.
Determine 8 KPIs
Start by defining Key Performance Indicators, or KPIs, for future sales, and envision how repeat businesses will fit into this mix.
When you break a huge undertaking down to specific numbers, even if they’re approximated, you’ll learn the path forward. Moreover, you will understand what an account management process will mean to your bottom line.
DEFINITIONS –
Marketing-Qualified Lead (MQL)
Usually this means a prospect has “raised their hand” to speak with a salesperson.
Sales-Qualified Lead (SQL)
A prospect who has all necessary ingredients to purchase from you: budget, authority, need, and timeframe.
KPIs –
1. Monthly Revenue Goal:
The revenue you need to generate each month as a result of your sales efforts
2. Average Deal Size
Self-explanatory
3. Average Subsequent Deal Size
This is pretty obvious if you have an offering that lends itself to re-purchases.
If you sell a “one-off” product, consider a value add, or an up-sell, you might provide. What sort of follow up service do your customers typically need? What sort of add-on products would be natural?
If this is unfamiliar, don’t worry, you can approximate everything for now.
4. Percentage Revenue for Each Lead Category
Enter the revenue you obtain from the three lead designations:
Inbound – New engagements from leads that come to you
Outbound – New engagements that you hunt down and win
Existing customers – Those who have purchased from you; account management determines your results in this column
5. Visit to Lead Rate
The percentage of people who go from a touch point with your company to becoming Marketing Qualified Leads, or MQLs.
A touch point might be considered visit on your site, a positive response to a cold email you send, or a quick conversation at a trade show. Regardless, it should represent at least a basic level of interest.
6. Lead to Opportunity Rate
The percentage of leads you’re able to convert to being Opportunities, or Sales Qualified Leads (SQLs)
7. Opportunity Win Rate
Basically your close rate, or the rate at which you get SQLs to sign on the dotted line
8. Average Cost Per Lead
This will vary depending on your inbound, outbound, and account management processes, and the nature of your business. As a rough benchmark, inbound leads cost 50-60% less than outbound (source: Optify).
You might base this on what you pay for PPC, or the time you or your team invest in different content creation activities, based on an hourly rate. For example, inbound would cover blogging and podcasting. Outbound would cover networking, trade shows, and cold outreach.
The case of Leon
Maybe your head is spinning in response to all of these definitions, so let’s go through a hypothetical.
Meet Leon. He runs a digital marketing and web design shop for restaurants.
Here’s what his KPIs look like before he builds a repeatable account management process…

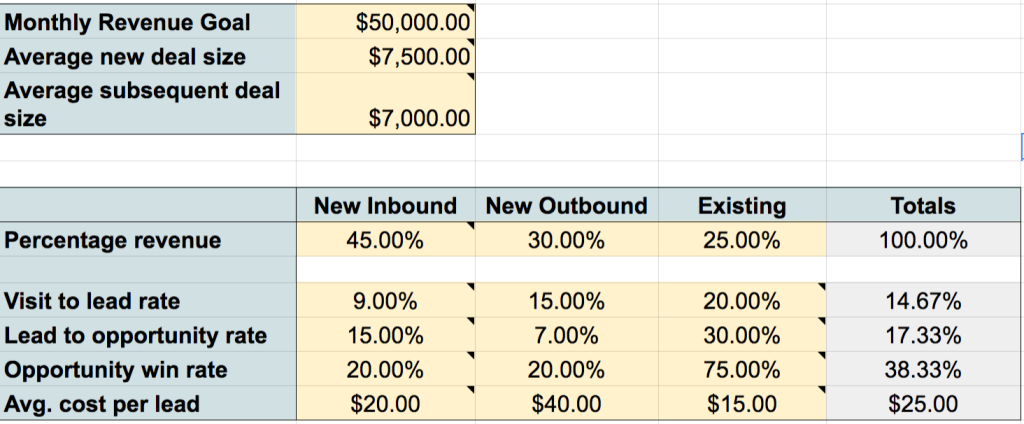
1. Monthly revenue goal: $50,000
2. Average deal size: $7,500
Based on the cost of a typical restaurant website.
3. Subsequent deal size: $1,000 (more on this cover this later…)
He does not have an account management process, so getting repeat business is pretty rare. Occasionally previous clients hit him up for minor touch-ups.
4A. Inbound percentage revenue: 50%
How is Leon doing when it comes to generating new business? He’s pretty evenly spread between inbound and outbound. On the inbound side of the fence, he invests in PPC, and he pays a content development shop to write and promote blog posts.
4B. Outbound percentage revenue: 45%
On the outbound side, he attends trade shows and networking mixers, and he does email outreach to targeted lists.
5A. Inbound visit to lead rate: 9%
For inbound, he knows that around 9% of the traffic he gets from places like ads and blog posts converts to leads. They convert by filling out a form on his site.
5B. Outbound visit to lead rate: 15%
For outbound, this rate is higher because his targeting is more specific. He stays very far away from large-scale email blasts.
6A. Inbound lead to opportunity rate: 15%
Since inbound leads are reaching out to him proactively, they usually have an imminent need, and they are more likely to become SQLs. They often have a schedule for getting started, and well-defined budgets.
6B. Outbound lead to opportunity rate: 7%
On the outbound side this figure is lower because the people he is targeting are less likely to have pain, or an imminent need at the moment he is contacting them.
7. Opportunity win rate (close rate): 20%
Finally, it’s time for Leon to crunch the numbers for his Opportunity to Win rate, or close rate. As a general rule, these numbers should be the same for inbound and outbound leads, and that’s what Leon observes when he cross references his CRM. That’s because at this stage in the buying cycle, the source of the lead is less relevant – they’re at the same sales-qualified juncture. He figures his close rate at 20%.
8A. Average cost per lead, inbound
He gathers these numbers from Google adwords and analytics, and the expenditures for blog writing and social media updates. All figures run on a monthly basis. He divides by the inbound total by the rough number of leads.
8B. Average cost per lead, outbound
For outbound, he considers the approximate time h invested on email outreach and in-person events. He also factors in the cost of certain lists he’s purchased, and divides by the rough number of outbound leads.
As is often the case, Leon’s outbound cost per lead is significantly higher. That’s mainly due to the time involved in researching, sending, and following up with cold prospects.
BEFORE Effective Account Management
Now Leon moves onto the existing customers column. This column reflects his account management process (or lack thereof). Historically, he invested very little resources in building relationship with his customers…. and it shows.
3. Average subsequent deal size: $1,000
(mostly website touch ups for old customers)
4C. Percentage revenue, existing customers: 5%
5C. Visit to lead rate, existing customers: 20%
He’s not sure about his visit to lead rate with his existing customers, because he has no account management process, and thus little data to work with. He never took the time to farm business through email outreach campaigns, nurture sequences, and other strategies.
So he makes an estimate. He’s right to figure that this rate will be at least as high as outbound. After all, these are people who have already purchase once, so getting them back to the site will be at least as easy as getting a cold prospect to the site.
6C. Lead to opportunity rate, existing customers: 30%
He knows that when existing customers become leads, they more often have an imminent need, and thus become sales-qualified at a relatively high rate. After all, they come in the door knowing his general price structure, and they trust him.
7C. Opportunity win rate, existing customers: 75%
From there, his opportunity win rate, or close rate, is relatively high, for similar reasons.
8C. Average cost per lead, existing customers: $10
He lowballs this figure because he has no account management process. He’s completely passive on that front… for now.
AFTER Account Management – Leon ups his game…
Leon crunches the numbers and he realizes that he’s facing a feast and famine cycle. Sometimes he gets lucky and he gets some inbound leads, other times his pipeline goes dry. Also, he never has enough hours in the day to do sales and client service well. Networking, writing blog articles, and turning around, and building sites is a serious grind.
Leon realizes that his greatest business opportunity is right in front of him, and it lies with his existing customers. He decides to implement a repeatable account management process…
3. Average subsequent deal size: $7,000
He decides he’s no longer going to wait for small touch-up jobs to come in. He shifts his emphasis to the few larger restaurant groups in his client roster, and drives them to re-purchase full fledged websites for additional restaurants in their portfolios. He anticipates this figure, conservatively, at $7,000.
4C. Percentage revenue, existing customers: 25%
He decides that he wants account management to take some of the weight off outbound, which is pretty costly. So he makes a modest percentage shift.
-He keeps the following KPIs the same, for the sake of creating a conservative investment. Plus, he’s still gathering data.-
5C. Visit to lead rate, existing customers: 20%
6C. Lead to opportunity rate, existing customers: 30%
7C. Opportunity win rate, existing customers: 75%
—
8C. Average cost per lead: $15
He bumps up the average cost per lead for existing customers a bit, since he knows he’ll be investing more resources in his account management process. That said, he knows the numbers will be significantly lower than new business.
After a few months of emphasis changes and new strategies, Leon observes his results….
ROI
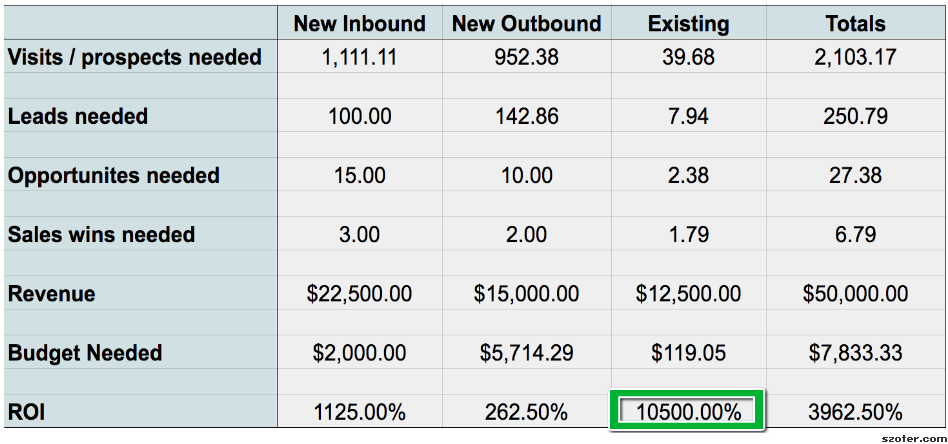
He finds that the account management ROI for is massive, at a whopping 10,500%. Even if he goes way more conservative with his numbers, repeat business wins by miles. Since he laid out everything in his spreadsheet, he knows what he’s aiming for, he can visualize outcomes, and results are attainable.
Why this transformation is possible
You might be concerned that this pie in the sky hypothetical won’t match your experience. You shouldn’t be. The overarching research agrees with Leon’s results…
“The probability of selling to an existing customer is 60 – 70%. The probability of selling to a new prospect is 5-20%”
– Marketing Metrics
“It costs 6–7 times more to acquire a new customer than retain an existing one”
– Bain & Company
Maybe you’re worried that you can’t go for this transformation because your product or service does not lend itself well to re-purchases. First, consider the cash cow customers who you might be treating like normal, everyday buyers. Could you be doing more to drive follow up engagement with large companies, or organizations with ongoing needs?
Second, if you’re drawing a blank, consider ancillary offerings, and upsells. What sort of follow up offerings do your customers typically need? What add-on products would be natural? What might you charge for these additions?
Maybe this is as simple as a monthly consulting service to help your customers get the best results . Or maybe it’s a widget, book, or tool.
Coming up next…
Hopefully you are starting to see some possibilities on the horizon. But how do you get there? How do you develop a process that drives business with your existing customers?
There’s one specific method that brings more dramatic results than any other. It’s all about over-delivering with ease. It’s pretty easy to implement, and I’ll show you how soon.
—
How do you typically plan out your sales and account management goals? Let me know in the comments…